
HyperViz
Live Hyperliquid market visualizer. Seven views: bubble map, heatmap, scatter, live L2 liquidity, liquidation zones, funding radar, leaderboard. Read-only, no auth.

Fork opens your own copy in the builder to customize and publish. Preview launches the live, no-wallet demo to click around first.
What it is reading right now
HyperViz charts liquidity, liquidation zones and funding across markets like these, read live.
| Market | Price | Funding | Open interest |
|---|---|---|---|
| BTC | $83,600.50 | 0.0013% | 459 BTC |
| ETH | $2,691.15 | 0.0013% | 11,504 ETH |
| SOL | $118.93 | 0.0010% | 110,882 SOL |
| HYPE | $85.69 | 0.0013% | 153,418 HYPE |
Read from the Pacifica perpetual book, through our own keyless relay at 2026-09-29 20:24 UTC, refreshed at most every five minutes. These are the markets the template reads; this page is not the template running.
What it does
- 7 live market views, bubble map, heatmap, scatter, leaderboard
- Real-time L2 order-book liquidity
- Liquidation zones + funding-rate radar
- Pure public Hyperliquid data, no wallet or key needed
Try it live
Open full screen ↗Live, no-wallet demo. Click around, then Fork it to make it your own.
More templates

HyperBoard: Crypto Market Dashboard
dashboardReal-time dashboard showing prices, funding rates, open interest, and liquidity across crypto perpetual markets. 3 tabs: Market, Liquidity, Funding. Uses Mithril API for live data.

OddsBoard
dashboardLive prediction markets visualizer across Polymarket + Kalshi. Six views: market grid, probability heatmap, extremes, discovery scatter, categories, leaderboard. Read-only, no auth.
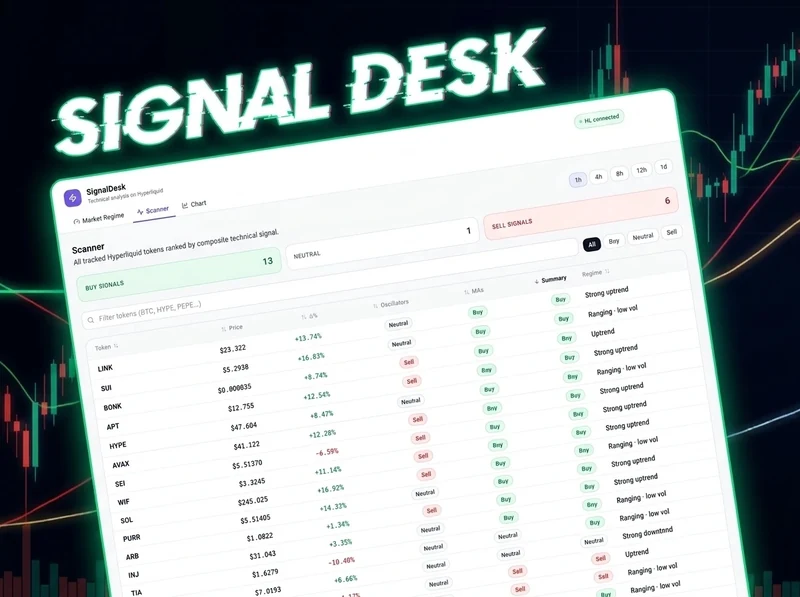
SignalDesk
tradingTechnical analysis workstation on Hyperliquid. Three views: market regime gauges, multi-token scanner ranked by composite signal, and a candle chart with client-side EMA / SMA / Bollinger / SuperTrend / Ichimoku overlays plus RSI / MACD / Stochastic / ADX momentum panel.