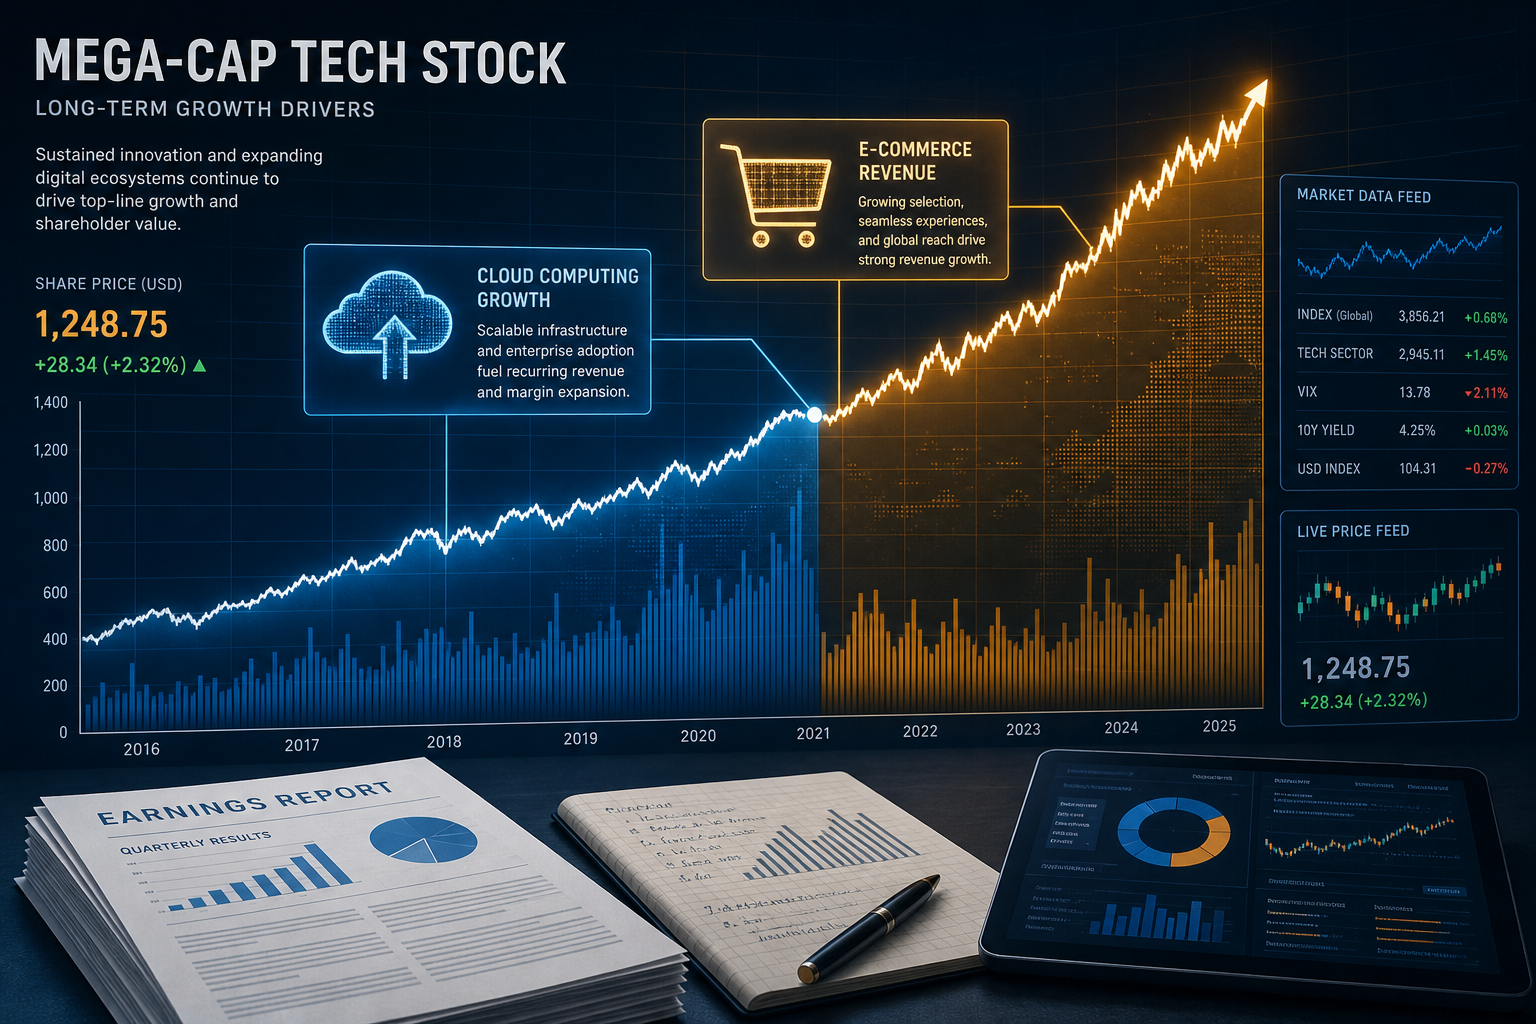
Inside the forces that move AMZN stock price
From AWS growth to earnings beats, here is what actually drives Amazon's market valuation.
Build your own AMZN stock price tracker
Track AMZN alongside your whole portfolio by building your own live price dashboard on Mithril.
Why AMZN stock price moves the way it does
Amazon trades on the Nasdaq under the ticker AMZN, and its price at any moment reflects the market's collective bet on the company's future earnings power. That sounds abstract, but the mechanics are concrete: when Amazon reports a quarter that beats expectations, buyers rush in and the price rises. When guidance disappoints, sellers push it down, often sharply. The stock does not move on revenue alone. Operating margin matters just as much, because a company growing revenue while compressing margins is a different story than one growing both at once. Amazon's Q2 2026 operating margin reached 13.7%, up from 11.4% a year earlier, which tells the market that growth is becoming more profitable, not less.
AWS is the earnings engine the market watches most
Retail is Amazon's largest revenue segment by far, but AWS (Amazon Web Services) is the segment that moves the stock most reliably. Cloud infrastructure carries operating margins that retail cannot match. AWS operating margin expanded to approximately 39.4%, and AWS revenue surged 36.7% year over year, marking its fastest growth in 18 quarters as cloud and AI demand accelerated. When AWS accelerates, the market re-rates the whole company upward, because high-margin cloud revenue is worth more per dollar than low-margin retail revenue. Investors watch AWS growth rate as a leading signal: if it slows, the stock often sells off even when total revenue is fine.
Valuation metrics tell you what the price already assumes
The raw share price tells you what it costs to buy one share. Valuation metrics tell you whether that price is cheap or expensive relative to what the company actually earns. The price-to-earnings (P/E) ratio divides the share price by earnings per share. Amazon's EPS (trailing twelve months) stands at 12.44, and the market capitalization sits at approximately 2.83 trillion USD, placing it firmly in the mega-cap category. A high P/E means the market expects strong future growth; a low one means expectations are modest or the stock has fallen. Neither is automatically good or bad. The question is whether the growth the market is pricing in is achievable.
Analyst targets and sentiment shape short-term pressure
Sixty analysts currently cover AMZN with an average rating of "Strong Buy" and a 12-month price target implying a roughly 24% increase from the latest price. These targets are not predictions so much as structured opinions: each analyst builds a model of Amazon's future cash flows, discounts them back to today, and arrives at a fair value. When the consensus target is well above the current price, it creates buying pressure. When the stock trades above consensus, it can face selling pressure as the upside narrows. Targets shift after every earnings report, so the gap between price and target is always a moving reference point, not a fixed floor or ceiling.
Broader market conditions amplify or dampen every move
AMZN does not trade in isolation. Interest rate expectations, inflation data, and overall risk appetite all influence how much investors are willing to pay for future earnings. When rates rise, future earnings are discounted more heavily, which tends to compress valuations for high-growth stocks. When risk appetite improves, money flows back into large-cap tech. Trading volume is a useful signal here: a price move on high volume carries more conviction than the same move on thin volume. Tracking AMZN alongside broader Nasdaq conditions, rather than in isolation, gives a much cleaner read on whether a move is company-specific or just the market tide going in or out. For a comparable look at another large-cap tech name, see what drives the NVDA stock price.
A small change in AWS growth rate moves Amazon's total valuation more than a large swing in retail revenue ever could.
Start with the business segment mix
Amazon operates three main segments: North America, International, and AWS. Retail-related revenue represents approximately 74% of total revenue, AWS around 17%, and advertising services roughly 9%. Understanding this mix is step one, because a price move driven by AWS acceleration is structurally different from one driven by a holiday retail surge. Each segment has different margin profiles and different growth ceilings.
Check the earnings trend, not just the headline number
A single quarter's earnings number means little without context. Look at the year-over-year change: Amazon's full-year 2025 earnings grew 31.09% compared to the prior year, on revenue that grew 12.38%. That gap between revenue growth and earnings growth signals improving operational efficiency. When earnings grow faster than revenue, margins are expanding, which the market tends to reward.
Compare P/E against growth expectations
The P/E ratio is only meaningful relative to growth. A high P/E on a company growing earnings at 30% per year may be justified; the same P/E on a company growing at 5% is a warning sign. Weigh the multiple against the growth rate the company is actually delivering, not the growth rate analysts hope for. Amazon's EPS of 12.44 (TTM) is the denominator; the share price is the numerator. Watch both.
Watch the 52-week range for context
The 52-week high and low bracket the range of prices the market has accepted over the past year. A stock trading near its 52-week high is in strong momentum; one near its low may be under pressure or presenting a re-entry point, depending on why it fell. Neither extreme is a buy or sell signal on its own, but the range gives you a sense of where current sentiment sits relative to recent history.
Factor in macro and sector conditions
Large-cap Nasdaq stocks like AMZN are sensitive to interest rate moves and broader risk sentiment. When the Federal Reserve signals rate cuts, growth stocks often re-rate upward because future earnings are discounted less. The reverse applies when rates rise. Isolate company-specific news from macro noise by checking whether the whole Nasdaq is moving in the same direction before attributing a price change to Amazon alone. For a parallel on how this plays out with another major tech name, see the NVDA stock price explainer.
Build a live view to track it in real time
Static snapshots of AMZN go stale fast. A live price board that surfaces price, volume, EPS, and segment data in one place gives you a much cleaner picture than toggling between tabs. Mithril Builder lets you describe exactly the dashboard you want in plain English and publishes it to a real address, connected to live market data from the first version. No placeholder numbers, no manual refreshes.
AWS drives disproportionate value
AWS represents roughly 17% of Amazon's total revenue but carries an operating margin around 39.4%, far above the retail segments. A small change in AWS growth rate has an outsized effect on total company earnings, which is why the market watches it so closely.
Earnings growth outpacing revenue growth
In 2025, Amazon's earnings grew at more than twice the rate of revenue, signaling that operational efficiency is compounding on top of scale. This kind of margin expansion is one of the clearest bullish signals in a large-cap stock.
Strong analyst consensus with upside implied
With 60 analysts rating AMZN a "Strong Buy" and a 12-month price target implying roughly 24% upside from the latest price, the professional consensus is unusually aligned, though targets always carry uncertainty and shift with each earnings cycle.
Mega-cap liquidity reduces execution risk
A market cap of approximately 2.83 trillion USD means AMZN trades with extremely high liquidity. Large orders move the price less than they would in smaller stocks, making it easier to enter and exit positions at prices close to the quoted level.
AI tailwinds are already showing in the numbers
AWS's AI business and its custom chips each crossed a significant annualized revenue threshold, more than doubling year over year. AI demand is not a future promise for Amazon; it is already visible in the current margin and growth figures.
Deciding whether to add after an earnings beat
Amazon reports a strong quarter: revenue up 20% year over year, EPS well above estimates, AWS growth accelerating to its fastest rate in 18 quarters. The stock gaps up at the open. The question is whether the move already prices in the good news or whether the fundamentals justify chasing it. Comparing the post-earnings P/E to historical ranges and checking whether analyst targets have moved above the new price are the two most useful filters here.
Tracking AMZN as part of a broader portfolio
A trader holding a basket of large-cap tech stocks needs to know when AMZN is moving on company-specific news versus when the whole sector is moving together. Separating idiosyncratic moves from macro moves changes the hedging decision entirely. A live price board that shows AMZN alongside sector benchmarks and volume data makes this distinction visible at a glance. Mithril Builder is designed for exactly this kind of custom multi-asset view. For a look at how a similar analysis applies to another holding, see Robinhood's revenue and earnings breakdown.
Evaluating AWS growth as a valuation signal
AWS operating margin expanded to approximately 39.4% in Q2 2026, and its AI-related revenue more than doubled year over year. For an investor trying to value Amazon, the AWS margin trajectory is the single most important number to track, because it determines how much of total revenue converts to profit. A slowdown in AWS growth, even with strong retail numbers, tends to compress the valuation multiple the market applies to the whole company.
Using historical splits to interpret the price level
Amazon's 20-for-1 stock split on June 3, 2022 reduced the nominal share price by a factor of 20 without changing the underlying value of a shareholder's position. New investors sometimes compare today's price to pre-split prices and draw incorrect conclusions about how much the stock has moved. Always adjust for splits when building any historical price chart or comparing price levels across time. Most data providers handle this automatically, but it is worth confirming.
What is the AMZN stock price today?
The live AMZN stock price changes continuously during Nasdaq trading hours and is available on any major financial data platform. For a real-time quote, check sources like Nasdaq's AMZN page or a live market data feed. The price at any moment reflects the most recent trade, not an average or an estimate.
Why does the AMZN stock price move so much on earnings days?
Earnings reports compress months of uncertainty into a single data point. When Amazon reports revenue, EPS, and segment results, the market rapidly reprices based on whether the numbers beat or miss expectations and whether the forward guidance raises or lowers the bar. The magnitude of the move depends on how far actual results deviate from consensus estimates, not on whether results are good in absolute terms.
How does AWS affect the overall Amazon stock valuation?
AWS generates operating margins roughly three to four times higher than Amazon's retail segments. Because high-margin revenue is worth more per dollar in a discounted cash flow model, AWS growth disproportionately lifts the total company valuation. AWS revenue grew 36.7% year over year in Q2 2026, its fastest rate in 18 quarters, which was a key reason analyst targets moved higher after that report.
What did Amazon's 20-for-1 stock split mean for the share price?
The split on June 3, 2022 divided each existing share into 20 shares, reducing the nominal price per share by a factor of 20. The total market value of a shareholder's position did not change; only the number of shares and the price per share changed. Splits are often done to improve accessibility for smaller investors by lowering the per-share price.
How is the AMZN P/E ratio useful for assessing the stock price?
The P/E ratio divides the current share price by earnings per share (Amazon's TTM EPS is 12.44), giving a sense of how much the market is paying for each unit of current earnings. A high P/E signals that the market expects strong future growth; whether that expectation is justified depends on whether AWS, advertising, and retail can sustain their current trajectories. Comparing AMZN's P/E to its own historical range and to sector peers gives the most useful context.
Build a live AMZN dashboard, your way
AMZN is one of the most data-rich stocks on the Nasdaq, and tracking it well means pulling together price, segment data, and macro context in one place. Build your own live Amazon price board on Mithril: describe what you want, and it ships connected to real market data.