Survivorship bias, and what an interface can do about it
Survivorship bias is drawing a conclusion from the things that are still here, when the things that are gone were the ones that would have changed it, and it is hard to catch because the missing rows leave no trace in the data or in the interface showing it.
It is the easiest bias to explain and the hardest to notice, because the evidence for it is by definition not on your screen. Everything you are looking at is a thing that survived long enough to be looked at.

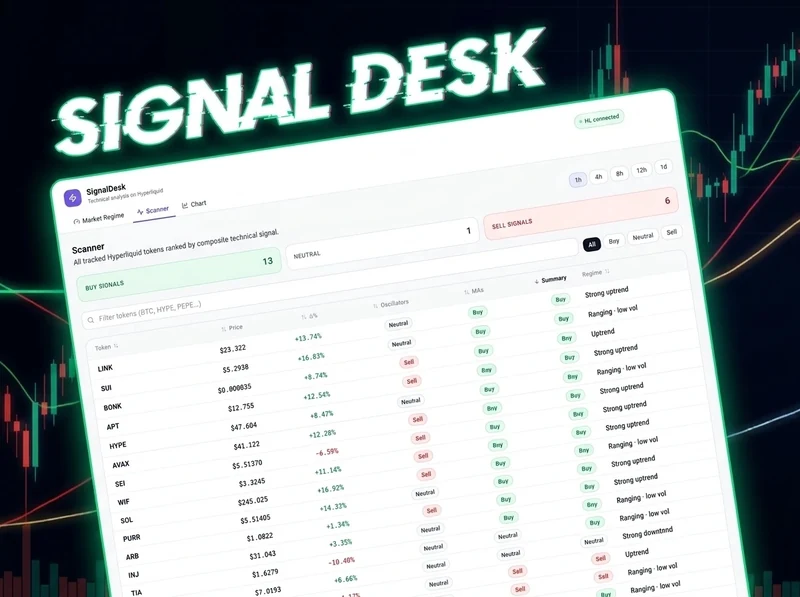
Start from a working app
SignalDesk
a multi-token scanner ranked by a composite signal, with a candle chart and technical indicators, on Hyperliquid.
Open the template
The shape of it, in one case
Take the list of markets a venue quotes today and compute how the average one performed over the past year. The number will be good. It is also close to meaningless, because anything that collapsed, was delisted or stopped being quoted is not in the list you started from. You did not exclude the failures on purpose. You started from a list that had already excluded them for you, and no step in your own work was wrong.
Why it flatters in one direction, always
The rows that go missing are not a random sample. They disappear for reasons correlated with being bad: going to zero, losing liquidity, being removed by a venue that no longer wants them. So the surviving set is better than the real one every time, never worse. What nobody can tell you is by how much, because the size of the gap is exactly the thing the missing data would have told you. Anyone quoting a correction figure is estimating from a different dataset and should say which.
How to tell whether your own number has it
Ask one question of the dataset: what was removed, and when. If the answer is that nothing was removed, find out whether that is because nothing failed or because failures were never recorded, because those two produce identical data and opposite conclusions. The tell is usually the start date, since a universe defined as the things that exist today and then measured backwards cannot contain anything that stopped existing in between. The short version, which takes seconds on any table you are about to believe: ask what would be missing from this list if it had failed, and treat an exclusion you have not measured as unknown rather than as none.
Where it enters without anyone deciding it should
Almost never at the analysis step. It arrives in the fetch: an endpoint that returns current instruments, a database of active accounts, a file of funds that still report, a scrape of pages that still resolve. By the time the data reaches the part of the code anybody reviews, the exclusion already happened upstream and looks like a complete dataset. This is why reading your own analysis carefully does not find it, and why it survives code review.
A footnote does not fix it
The usual remedy is a methodology note under the figure. It does not work, and the reason is not carelessness: the number is what gets read, remembered and repeated, and the note is not. If a result rests on a sample missing its failures, the honest place for that fact is beside the result, in the same weight, where a reader cannot take the number without it. That is an interface decision rather than a statistics one, which is why it usually gets left to nobody.
What an interface can do instead
State the count. Included, excluded, and the period, next to the figure rather than under it, and where the excluded count is genuinely unknown, say that instead of implying none. It is a weaker claim than a corrected number and a far stronger one than silence, which every reader parses as nothing is missing. The nine components below are our attempt at that for the cases that keep recurring, and the first one is this one.
Nine components that say they do not know
These are real components, rendered here rather than described. Ask the builder for any of them by name and you get this code, not a screenshot of it. The inputs below are examples; what is real is what each one does with them.
SurvivorshipNote
Says what was excluded from a sample, and over what period.
It is computed from the 112 that still exist, out of 153 over the last 12 months - 73% of the original set. The rest are gone because they were delisted or stopped being quoted during this period, and those are disproportionately the bad outcomes. The figure above is therefore better than the real one, and we have not adjusted it, because adjusting would need the data we do not have.
- When it is the wrong answer:
- A sample with nothing excluded.
- With the data missing:
- Without an excluded count it says the exclusion is unmeasured, which is not the same as zero.
SampleTooSmall
Withholds a rate the sample cannot support and shows the count instead.
Not shown as a percentage. 3 trades cannot support a win rate - the division would be correct and the number would still tell you nothing. It appears once there are at least 30.
- When it is the wrong answer:
- A figure where the reader already knows the sample, or where the count is the point and a rate would be noise.
- With the data missing:
- Nothing is withheld, because nothing was claimed: it renders the count alone, and never invents a threshold it did not meet.
OverfitRisk
Reports how many parameters and combinations produced a backtest number.
Roughly 7 observations for every knob that was turned. There is no threshold that makes a backtest true, so this is stated rather than scored.
500 parameter sets were evaluated before this one was chosen, so this is the best of 500 draws. A best-of-many looks good even when nothing real is there, and only the winner is usually reported.
Nothing was held back, so every observation here was used to choose the parameters. There is no out-of-sample result on this page.
- When it is the wrong answer:
- A live result. It is about the size of the search, not about performance.
- With the data missing:
- Without a combinations count it reports parameters and observations and says the search size is unknown, rather than implying one.
CoverageGap
Says how much of the universe a result actually covers.
40 more were never examined, because no funding feed. The real universe is 233, so treat the share above as a share of what we could read, not of everything.
The denominator is here because a small share is not automatically bad and a large one is not automatically good. Whether these markets are the ones you can actually use is a judgement this page cannot make for you.
- When it is the wrong answer:
- A complete set. "8 of 8" is noise.
- With the data missing:
- If the examined count is unknown it says so, rather than printing a percentage of an unknown denominator.
FreshnessGate
Replaces a value that has gone past a stated age, rather than badging it.
We cannot tell how old this reading is, so we will not show it. An unknown age is not the same as a fresh one.
- When it is the wrong answer:
- A price a person can judge for themselves. Use a stale badge there; this is for numbers where acting on an old one is worse than acting on none.
- With the data missing:
- An absent timestamp is unknown age, and unknown age fails closed: the value is withheld, not shown.
SourcesDisagree
Shows two feeds' answers side by side and refuses to average them.
What each source says
2 of 2 answeringThese disagree by 0.98%, which is above the 0.5% we treat as normal. Both numbers are shown and neither is averaged, because the mean is a silver price no venue will trade at and it would hide the gap.
- When it is the wrong answer:
- A single source. It has nothing to say there and should not be decoration.
- With the data missing:
- With one side absent there is no disagreement to show, so it falls back to the single value rather than implying a second opinion.
NotProvided
Names a field the source does not carry, and names the source that lacks it.
This is a gap in what the source returns, not an error on this page and not a value of zero. Nothing is being hidden and nothing failed.
- When it is the wrong answer:
- A value that failed to load. That is an error, and calling it not-provided hides a fault we could fix.
- With the data missing:
- It is the missing state: its whole content is the absence and who is absent.
UnitCheck
Refuses to compare two numbers that are not the same kind of thing: a rate per eight hours against one per year, basis points against percent, APY against APR.
These are not the same kind of number. One is in % per 8h and the other in % per year, so no difference is shown. Subtracting them would produce a figure that looks right and is wrong, which is worse than showing nothing.
- When it is the wrong answer:
- Two values already in one unit.
- With the data missing:
- An unlabelled unit is unknown and blocks the comparison. It does not guess that two unlabelled numbers match.
AssumptionsPanel
Separates the measured inputs of a total from the assumed ones.
What this cost estimate is built from
1 of 3 inputs is not known, so this total is missing one and is lower than the real figure. It is not the answer, it is the part we can stand behind.
- When it is the wrong answer:
- A figure with one input, or where every input is measured.
- With the data missing:
- An input with no source is shown as assumed, never quietly counted as measured.
Live, right now, on this page
| Market | Price | Funding | 24h volume |
|---|---|---|---|
| BTC | $86,364.50 | 0.0013% | $522,866,341 |
| ETH | $2,750.85 | 0.0013% | $301,603,802 |
| SOL | $118.01 | 0.0013% | $94,709,358 |
| HYPE | $96.97 | 0.0013% | $3,938,323 |
Live markets, read from the venue as this page rendered. Note what a list like this cannot show you: everything the venue stopped quoting. Read at 2026-09-23 02:12 UTC; accurate as of that time and not afterwards.
Start from a working app

Open, change it, publish your own
Delta Neutral - Multi Dex
scans perpetual exchanges for funding rate mispricings, then opens and manages the positions.
Open the template
Working templates built around what this page covers. Open one, change it, and publish your own.
- SignalDesk
a multi-token scanner ranked by a composite signal, with a candle chart and technical indicators, on Hyperliquid.
- Delta Neutral - Multi Dex
scans perpetual exchanges for funding rate mispricings, then opens and manages the positions.
Common questions
What is survivorship bias in simple terms?
Judging something by the examples that are still around, when the ones that are gone would have changed the answer. Company track records, fund returns, strategy backtests and top-performer lists all have it by default, because the sources they are built from list what exists now rather than what existed then.
How do I avoid survivorship bias in a backtest?
Use a dataset that keeps delisted and dead instruments with the dates they stopped trading, which is the only real fix and usually costs money. If you cannot, the next best thing is to state the exclusion beside the result rather than correcting for it with a guess: say how many instruments the test covered, over what period, and that anything removed during it is absent.
Is survivorship bias the same as selection bias?
It is one kind of selection bias, the kind where the selection was done by time and by failure rather than by you. That distinction matters in practice because there is no sampling step to fix. The filtering already happened before the data reached you, which is why it survives a careful review of your own method.
Why is survivorship bias worse in crypto data?
Because instruments are delisted often and quickly, and public endpoints almost always return what is currently quoted with no record of what was dropped. A one-year study of today's markets on most venues is a study of a list that has been quietly pruned several times, and nothing in the response says so.
Related reading
All guides · Live market pages · Components · Make Mithril a preferred source in Google