Live market
Silver price today, live, with the week's tape
The silver price today on this page is a perpetual contract on XAG read live from Pacifica in dollars per troy ounce, shown with the seven-day range, realised volatility and book spread, and it tracks the spot price without anybody holding or delivering metal.
Read from the exchange as this page rendered. This is a perpetual contract on silver quoted in dollars per troy ounce, which is a different instrument from a spot quote or a coin dealer's price.


Run it instead of reading it
Commodities Delta-Neutral
delta-neutral funding-rate arbitrage across commodity perps, gold, silver, oil, gas, copper and platinum.
Open the template
Signals, right now
Read from the Pacifica perpetual book at 2026-09-27 23:12 UTC, through our own keyless relay, and refreshed at most every five minutes. Any figure quoted from this page is accurate as of that time and not afterwards.
Silver is two markets wearing one price
Roughly half of silver demand is industrial, in solar cells, electrical contacts and brazing alloys, and the rest is investment and jewellery. Gold has almost none of the first. That split is why silver can rally on a manufacturing survey that leaves gold flat, and why it falls harder in a growth scare even when the monetary case is unchanged. When the realised volatility above runs well over gold's, this is usually the reason.
A thinner market moves further on the same news
The total value of silver traded is a small fraction of gold's, so an order that gold absorbs without moving can push silver several percent. The practical consequence is on the cost-to-cross figure above and on the seven-day range: silver's range is routinely two to three times gold's in percentage terms. Read the gold-silver ratio with that in mind, because most of its movement comes from this side.
Per troy ounce, and not the price of a coin
This number is dollars per troy ounce for the contract. A dealer selling a one-ounce coin charges a premium over it for fabrication, distribution and margin, and buys back below it. Those premiums move independently and widen sharply when retail demand spikes, which is precisely when people check a page like this. If you are pricing physical metal, start here and then ask the dealer, because the gap is the part this page cannot tell you.
The part we cannot verify
Pacifica publishes the symbol, the live book and hourly candles. It does not publish how the XAG reference price is derived, nor the interval its funding rate settles over, which is why the funding figure above is shown per interval and not annualised. The price was checked against an independent silver quote when this page was built and agreed to within a fraction of a percent, but that check is not repeated on every render.
Run it instead of reading it
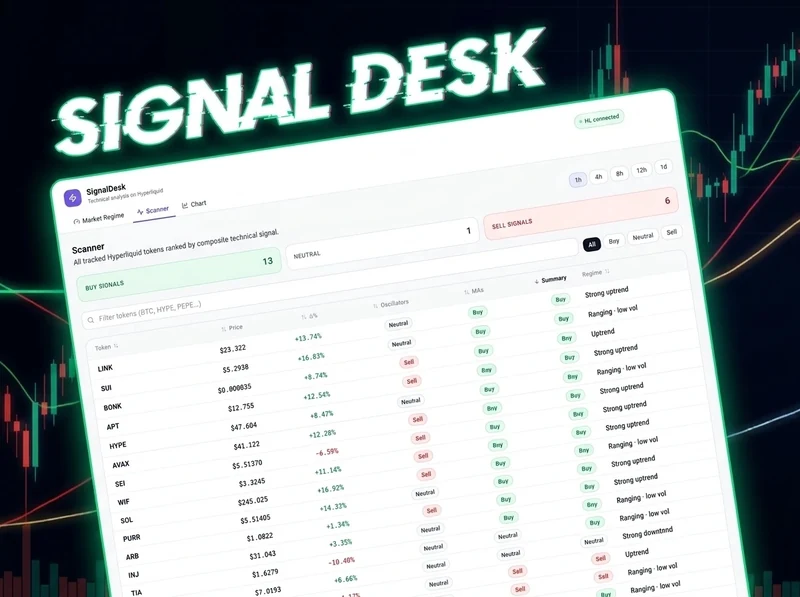
Open, change it, publish your own
SignalDesk
ranks tokens by a composite signal and charts them with EMA, Bollinger, RSI and MACD overlays, on Hyperliquid.
Open the template
Three working apps that read this kind of market. Open one, change it, and publish your own.
- Commodities Delta-Neutral
delta-neutral funding-rate arbitrage across commodity perps, gold, silver, oil, gas, copper and platinum.
- HyperBoard: Crypto Market Dashboard
prices, funding rates, open interest and liquidity across crypto perpetual markets, live.
- SignalDesk
ranks tokens by a composite signal and charts them with EMA, Bollinger, RSI and MACD overlays, on Hyperliquid.
Other live market pages · Make Mithril a preferred source in Google